Data has limitless potential to transform businesses and the world as long as people are empowered to use it.
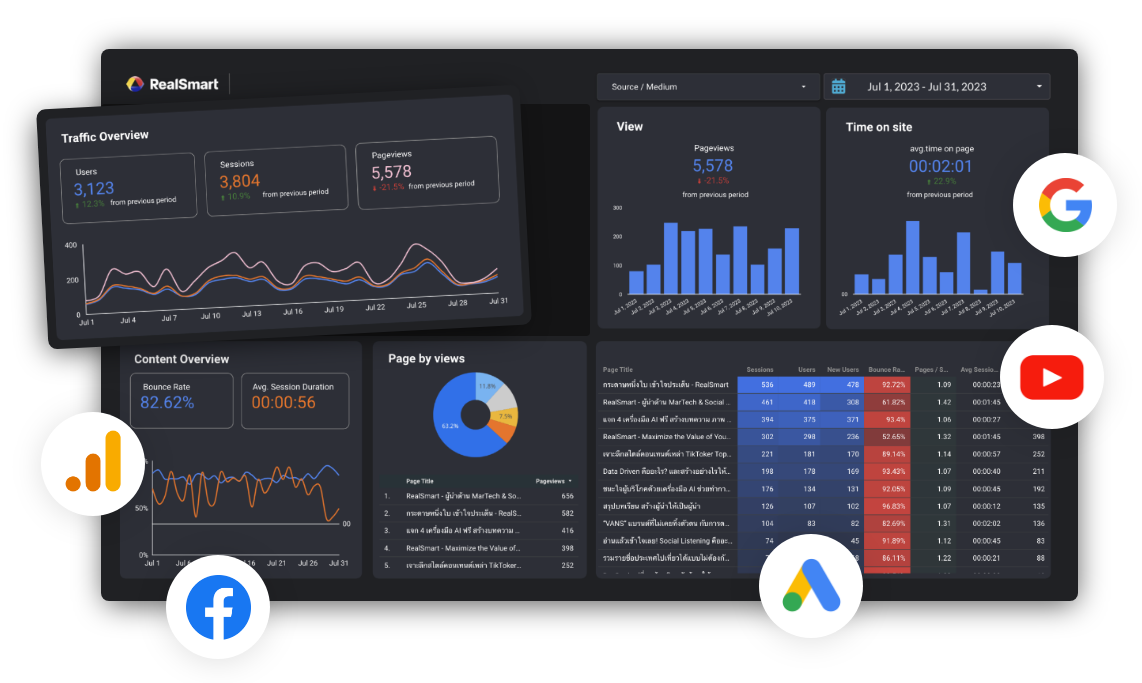
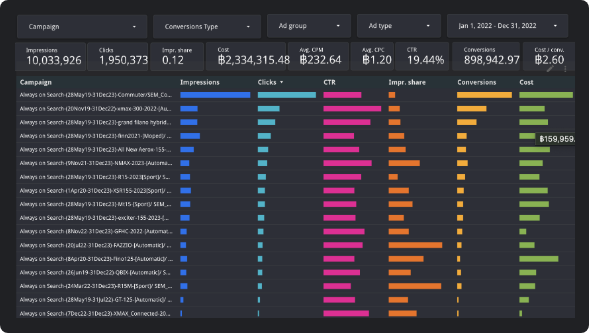
Data Visualization
The organization employs Data Visualization and applies it to address various Pain Points, leading to enhanced operational efficiency.
Increased Efficiency
Achieve even greater efficiency through the utilization of data.
BENEFITS
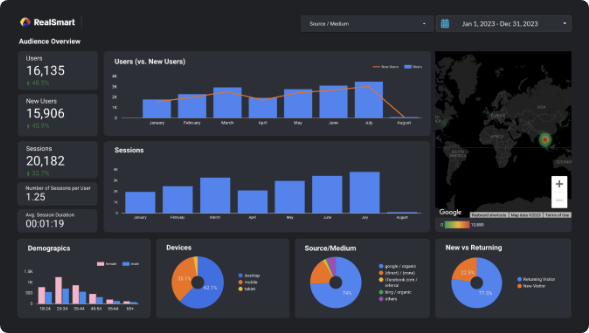
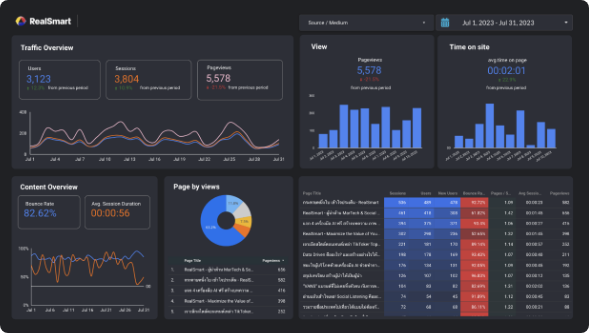
The key benefit of data visualization dashboards is their ability to transform complex and large datasets into understandable, visual representations. Here are some of the main advantages of using data visualization dashboards
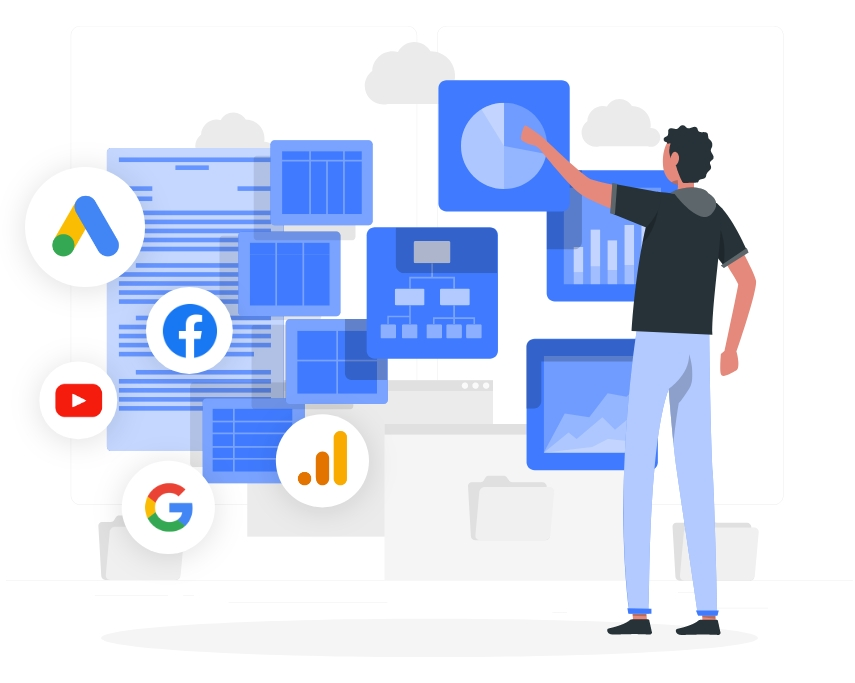
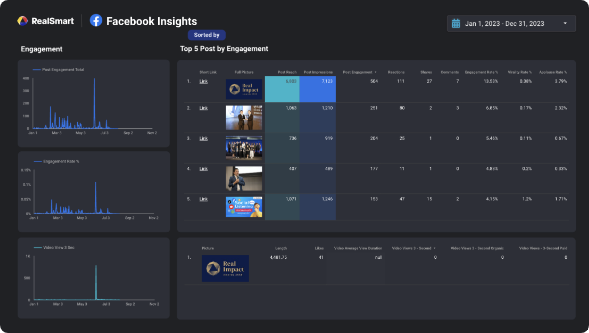
Visualize and analyze data from multiple sources
Google Ads
Google Analytics
Google Search Console
Youtube Analytics
Facebook Insight
Facebook Ads
Instagram Insight
Tiktok Insight
Twitter Insight
Twitter Ads
Facebook Page
Competitors Facebook Page
Premium Connectors :
File Upload (User Data Source) , SQL DB , Big Query
Benefits
The key benefit of data visualization dashboards is their ability to transform complex and large datasets into understandable, visual representations. Here are some of the main advantages of using data visualization dashboards:
Quick Insights
Data visualizations enable users to quickly grasp patterns, trends, and outliers within the data, which might be challenging to identify in raw numbers or text-based reports.
Decision Making
Visual representations make it easier to make data-driven decisions, as decision-makers can quickly understand the implications of the data and take appropriate actions.
Data Exploration
Dashboards allow users to explore data interactively. Users can filter, drill down, and zoom into specific data points, enabling deeper analysis and understanding.
Real-time Monitoring
Dashboards can provide real-time or near-real-time updates, allowing users to monitor key metrics and performance indicators as they change over time.
Effective Communication
Visualizations simplify the communication of complex information. They can help convey insights to a wide range of audiences, including those without a strong background in data analysis.
Collaboration
Dashboards provide a centralized platform for teams to collaborate and work with the same set of data. Everyone can refer to the same visualizations, reducing confusion and misinterpretation.
Increased Efficiency
Dashboards provide a centralized platform for teams to collaborate and work with the same set of data. Everyone can refer to the same visualizations, reducing confusion and misinterpretation.
img01
img02
img03
img04
Package
Silver
Gold
Diamond
4,999
Price/Month
8,999*
Price/Month
15,999*
Price/Month
Permission Given
View Only
Edit Access
Edit Access
Dashboard Customization **
-
Data Sources Limitation ***
2
5
7
Page Limitation
3
7
10
Widget Per Page
6
6
6
Connector Type
Standard Connectors
***
Premium Connectors
-
-
Service
Support
chat
chat
Phone
Silver
4,999
Price/Month
Permission Given
View Only
Dashboard Customization **
-
Data Sources Limitation ***
2
Page Limitation
3
Widget Per Page
6
Connector Type
Standard Connectors
***
Premium Connectors
-
Service
Support
chat
Gold
8,999*
Price/Month
Permission Given
Edit Access
Dashboard Customization **
Data Sources Limitation ***
5
Page Limitation
7
Widget Per Page
6
Connector Type
Standard Connectors
Premium Connectors
-
Service
Support
Chat
Diamond
15,999*
Price/Month
Permission Given
Edit Access
Dashboard Customization **
Data Sources Limitation ***
7
Page Limitation
10
Widget Per Page
6
Connector Type
Standard Connectors
Premium Connectors
Service
Support
Phone
Remarks :
** Can be edited up to 4 times per year, with a total of no more than 10 widgets, at no additional cost.
*** Additional data sources can be added at a rate of 1,500 baht per month per source.
**** Excluding Competitors’ Facebook Page.
Note :
This package price is applicable for one brand only. If the contract is for less than 12 months, there will be an additional Onboarding fee of 25,000 baht.
Get Quotation
Let’s Collaborate and Accelerate Your Business with Our Innovative Platform